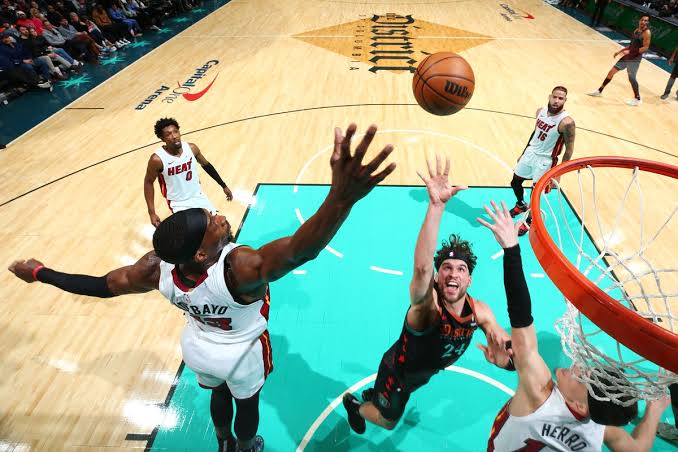
The Wizards lost a weird and competitive game against the Miami Heat, bringing their home record this season to an NBA worst 3-20.
Neither team could shoot, finishing the game with matching 47.2% effective field goal percentages. The Wizards shot 11-42 — 26.2% — from three-point range. Somehow, the Heat were even worse — 7-31 (22.6%).
While Miami had an atrocious shooting night, and the Wizards were trying to defend, it would be a stretch to say Washington caused the Heat’s misses. By my count, the Heat were 3-21 on open three-point attempts.
Two key difference makers: the Heat made up for their bricks by grabbing 14 offensive rebounds to Washington’s 6, and by attacking the paint relentlessly, drawing fouls and winning at the free throw line 27-17.
Meanwhile, Washington was utterly stymied by Miami’s zone defense. As Couper Moorhead tweeted, the Wizards managed just 0.68 points per possession against the Heat zone.
Washington Halfcourt Offense vs. Miami Defense
vs. Man: 1.02 ppp (65 poss)
vs. Zone: 0.68 ppp (25 poss, 21 in the second half)— Couper Moorhead (@CoupNBA) February 3, 2024
While the result was terrible, I liked Washington’s offensive scheme against Miami’s zone. The weak spot in a 2-3 is typically in the middle, usually at the free throw line — the nail, in NBA parlance. That was the case with the Heat, and the Wizards attacked by playing a base five-out set and running players from the weak side to the nail. Then instead of having the guy at the nail stand there and wait for a pass, he’d run out to the perimeter, vacating the middle, and opening the space for a teammate to cut into that spot.
It’s a clever design that forces defenders to track what’s happening in their zone and what’s behind them. And with better players, it might even work.
The Wizards encountered two basic problems. The first: when facing a zone and the ball is passed to the man at the nail, defenders typically react by contracting on that player in the middle. Not the Heat, though. The defenders out top and on the wings or baselines stayed wide to limit passes. Miami center Bam Adebayo stayed closer to the rim and dared whoever was at the nail to shoot.
Which brings me to the second basic problem: the Wizards bricked basically everything from that area. Unable to make shots or attack Adebayo and get to the rim or the free throw line, Washington’s offense degenerated into forced threes and “creation” (a euphemism for bad shots that don’t have much chance to go in).
This was not a case of the Wizards coaching staff blowing it by giving the players concepts that were too difficult. Their offensive design put players in position to make plays, and they simply weren’t good enough to actually make them. Such is life with a roster this bad.
This & That
Corey Kispert’s three-point shot returned — he hit 6 on 14 attempts en route to 26 points on 18 shots.
Daniel Gafford largely outplayed the celebrated Adebayo inside. He did a terrific job anchoring Washington’s defense and limiting the Heat’s ability to get to the rim, and he was one of two Wizards who competed on the defensive glass.
Deni Avdija made shots (6-8 from the floor) and grabbed eight rebounds. He also had three turnovers and five fouls, and didn’t have much defensive impact. Those three turnovers accounted for 25% of Avdija’s offensive usage. His whining to the refs has reached Beal-level absurdity. Last night, he argued a foul call after he wrapped his arm around Adebayo’s and held him back while fighting for a rebound. It was an obvious foul, as are most of the calls he doesn’t like.
Jordan Poole shot poorly and exhibited his usual terrible shot selection. He had a handful of good defensive possessions and attempted a flop while defending Jimmy Butler. He was credited with 10 assists — a mark so at odds with what I thought I saw while watching the game that I went back and reviewed them. In a very technical sense, I could see an argument for nine of them. His first — a transition pass to Avdija at midcourt, who then took three dribbles and Euro-stepped through traffic for a goal-tended layup — should not have been counted. Maybe I’m the Russian judge when it comes to assists, but I think he should have been awarded with five for the game.
Not a ton to love from Bilal Coulibaly — 12.5% usage and an offensive rating (points produced per possession x 100) of just 98. The defense was abysmal with him out there, and Washington was -19 during his minutes.
Crummy game from Tyus Jones — bad shooting, six assists (it should have been four), and subpar defense.
Kyle Kuzma was atrocious — 13 points on 5-16 shooting, 1-5 from deep, just four rebounds, and five fouls. His offensive rating was 78 (yikes) on an 18.7% usage.
Johnny Davis got a couple first half minutes and scored on a good cut and a nice feed from Poole.
Four Factors
Below are the four factors that decide wins and losses in basketball — shooting (efg), rebounding (offensive rebounds), ball handling (turnovers), fouling (free throws made).
Stats & Metrics
Below are a few performance metrics, including the Player Production Average (PPA) Game Score. PPA is my overall production metric, which credits players for things they do that help a team win (scoring, rebounding, playmaking, defending) and dings them for things that hurt (missed shots, turnovers, bad defense, fouls).
Game Score (GmSC) converts individual production into points on the scoreboard. The scale is the same as points and reflects each player’s total contributions for the game. The lowest possible GmSC is zero.
PPA is a per possession metric designed for larger data sets. In small sample sizes, the numbers can get weird. In PPA, 100 is average, higher is better and replacement level is 45. For a single game, replacement level isn’t much use, and I reiterate the caution about small samples sometimes producing weird results.
POSS is the number of possessions each player was on the floor in this game.
ORTG = offensive rating, which is points produced per individual possessions x 100. League average last season was 114.8. Points produced is not the same as points scored. It includes the value of assists and offensive rebounds, as well as sharing credit when receiving an assist.
USG = offensive usage rate. Average is 20%.
ORTG and USG are versions of stats created by former Wizards assistant coach Dean Oliver and modified by me. ORTG is an efficiency measure that accounts for the value of shooting, offensive rebounds, assists and turnovers. USG includes shooting from the floor and free throw line, offensive rebounds, assists and turnovers.
+PTS = “Plus Points” is a measure of the points gained or lost by each player based on their efficiency in this game compared to league average efficiency on the same number of possessions. A player with an offensive rating (points produced per possession x 100) of 100 who uses 20 possessions would produce 20 points. If the league average efficiency is 114, the league — on average — would produced 22.8 points in the same 20 possessions. So, the player in this hypothetical would have a +PTS score of -2.8.
Be the first to comment